SGPLOT の POLYGONステートメント でポリゴンを描画できます。
今回はこのステートメントの色々な書き方を紹介していきたいと思います。
以下の例をご覧ください。
| /* 座標を定義 */ data test; input segment x y; cards; 1 1 1 1 5 1 1 5 5 1 1 5 ; /* ポリゴンを描画 */ proc sgplot data=test; polygon x=x y=y id=segment / fill outline; xaxis min=0 max=6; yaxis min=0 max=6; run;  |
- 最初にデータステップでx軸とy軸の座標を定義
- SGPLOT の POLYGONステートメントで、座標間に順番に線を引いていって形をつくる(以下のようなイメージ)

| /* 座標を定義 */ data test; input segment x y; cards; 1 1 1 1 2 1 1 2 2 1 1 2 2 3 3 2 4 3 2 4 4 2 3 4 ; /* ポリゴンを描画 */ proc sgplot data=test; polygon x=x y=y id=segment / fill outline; xaxis min=0 max=6; yaxis min=0 max=6; run; 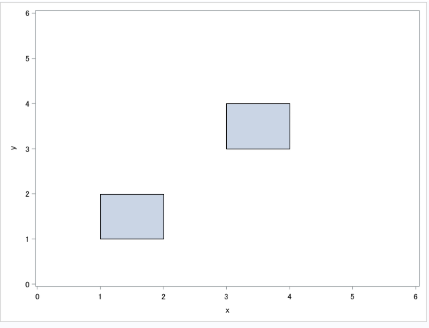 |
POLYGONステートメントで「id=segment」と指定しています。
この「ID=」に指定した変数の値ごとにポリゴンを別々に描画することが出来ます。
今回はSEGMENTという変数の値ごとに2つポリゴンを描画しています。
ちなみに、以下のようにポリゴンを重ねることも可能です。
| /* 座標を定義 */ data test; input segment x y; cards; 1 1 1 1 5 1 1 5 5 1 1 5 2 3 3 2 6 3 2 6 6 2 3 6 ; /* ポリゴンを描画 */ proc sgplot data=test; polygon x=x y=y id=segment / fill outline; xaxis min=0 max=6; yaxis min=0 max=6; run;  |
| /* 座標を定義 */ data test; input segment x y; cards; 1 1 1 1 5 1 1 5 5 1 1 5 1 . . 1 2 2 1 4 2 1 4 4 1 2 4 ; /* ポリゴンを描画 */ proc sgplot data=test; polygon x=x y=y id=segment / fill outline; xaxis min=0 max=6; yaxis min=0 max=6; run;  |
上で作成したデータセットのように、
- まず外側のポリゴンを定義した後、
- x軸とy軸が欠損値の行を用意することで、そこから穴の始まりを示すことが出来る。
- その後の定義は穴として描画される。
ちなみに、穴をちょっとずらして定義すると、以下のように面白い感じになる。
| /* 座標を定義 */ data test; input segment x y; cards; 1 1 1 1 5 1 1 5 5 1 1 5 1 . . 1 3 3 1 6 3 1 6 6 1 3 6 ; /* ポリゴンを描画 */ proc sgplot data=test; polygon x=x y=y id=segment / fill outline; xaxis min=0 max=6; yaxis min=0 max=6; run;  |
0 件のコメント:
コメントを投稿